Data is the most valuable asset right now in our world. And as we move on to more technical advancements, data will shape up to be the most valuable asset in the world. Data science is one of the most important elements for many organizations right now. It is basically the method of analyzing the raw data by utilizing statistics and machine learning techniques to conclude the information.
Speaking of which, data visualization is of massive significance right now. It is now more paramount than ever to have various ways in which you may view and understand the data. And the requirement of data skills in employees keeps increasing yearly. For aspiring students looking to build a career in the field, an all-rounded bast data analytics bootcamp is a must!
What is Data Visualization?
Data visualization is known to be a practice of transforming information into a more visual context. From maps to graphs, these visuals can be anything. They are generally done to make data easier for humans to understand and obtain insights. The primary goal behind data visualization is to make it effortless to identify trends, patterns, and outliers in larger data sets. Most of the time, the term is used interchangeably with others, such as statistical graphics, information graphics, and information visualization.
The importance Of Data Visualization
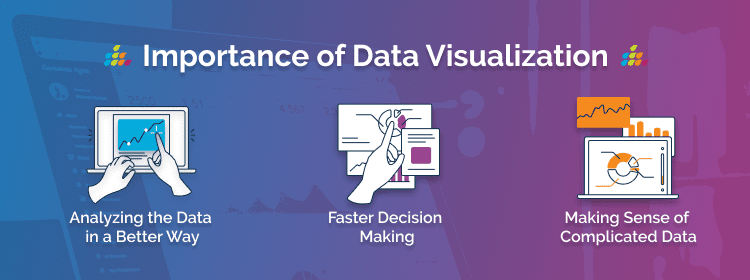
The significance of data visualization is straightforward. It makes sure people see, understand, and engage with the data better. Whether it is complex or simple, the right visualization is something that may bring everybody on the same page. Here are the reasons why data visualization is significant:
● Grants a perspective on data
Visualizing the data is something that grants a perspective of data by showing the meaning in more of a larger scheme of elements. It basically shows how certain data references stand, revolving around the overall picture of the data.
● Saves a lot of time
Without a doubt, it is obviously faster to get some insights from the data utilizing data visualization instead of just studying a chart.
● Assists in data exploration
Data visualization is something that allows the data scientists to explore the data and identify the Trends and patterns. And outliers efficiently. By using data, an individual may identify the bond between variables that may not be apparent when glancing at data in a tabular format.
● Better decision-making
Data visualization is vital for decision-making. This is because it allows the stakeholders to view patterns and trends that may not be immediately apparent in a set of raw data. While presenting data in a more visual format, the data scientists may assist the stakeholders in making informed decisions efficiently.
● Insights on communication
In addition to that, data visualization assists data scientists in communicating insights. To stakeholders in a simple format. A well-designed visualization may assist stakeholders who are not technical in understanding the complex data and making decisions. That is more informed based on the data.
● Storytelling
It is a vital component of data storytelling in developing compelling visualizations. The data scientists may develop a narrative around the data that resonates with the stakeholders.
● Treat to imagination
Nothing can ignite the viewer’s imagination more than gorgeous and well-presented data visualization. Visual images can stroke the imagination more easily than tables, which are more textural.
This is mainly because humans are visual beings and may understand data much faster if presented in a more visual format. This enables the users to use their imagination and deeply analyze the visualization, granting them more insights than just reading dry eggs and analyzing a data table.
● Beautiful presentation
Raw data can be called informative. However, it cannot be called beautiful. Visualization is the skill of presenting the data beautifully so that the users are also interested. After all, humans are primarily visual beings, and they may acknowledge information way faster if it is visually stimulating.
However, it does not sacrifice function for beauty in data. Visualization is crucial. The main purpose of data visualization is to impart information to the viewers efficiently, and there needs to be more sense in making it beautiful if that also makes it harder to understand.
Benefits of data visualization
Data visualization grants effective and quick ways to communicate data in a universal manner utilizing visual information. This sort of practice may help organizations identify which factors affect a variety of customers and pinpoint the areas that need improvement or attention. Furthermore, it makes the data more memorable for the stakeholders and helps them understand when and where to place specific products.
Here are some of the common data visualization benefits that you need to know:
- An enhanced understanding of the following steps that need to be taken to enhance the organization
- A distribution Of information that is easy and increases the chance to share the insights with everybody who is involved
- An enhanced power to act on the findings efficiently and get success with better speed and way fewer mistakes
- The power to soak information swiftly imp, rove the analytics, and make way faster decisions
- A developed power to maintain the user’s interest with data they can easily understand
- Decrease the requirement for data. Scientists as data is more accessible and very much understandable.
Wrapping up
As we move into the world of big data, visualization is increasingly becoming the key tool to make sense of the trillions of complex rows generated daily. Data Visualization assists in telling stories. It’s like writing data into a form that is way easier to understand and highlights the outliers And trends. A good visualization tells the story, eliminating the noise from data and highlighting the beneficial and useful information. Discover Data Analytics Courses.


